

My boss said, “I am tired of juggling all the data sources to view and track our business’s performance. Can you give me one place that tells me everything important in detail in one place? ” As a performance marketer, I want to make sure that I can see zoom in and zoom out of our data, and so my boss — Although fellow marketers at Databox are friends. I thought I give it a proper try for all marketers and give my verdict — So here’s the Databox review you wanted before giving a full try.
Here’s the probably most important information you need to know: It can actually replace your internal dashboards and excel sheets with the “database” data, too — And that is just too powerful.
Databox is a fantastic cloud-based business analytics tool that helps you monitor your progress along all your data sources simultaneously, helping you make accurate data-driven decisions. It’s simple, user-friendly, and highly customizable through innovative features and integrations.
In this article, I’ll be delving into Databox, one of the best business analytics and KPI dashboard platforms I’ve tried firsthand. Even though it’s relatively new in the market, Databox has plenty of handy features to impress you as they did me! Keep scrolling to get a complete Databox review, along with its essential features, pros, cons, and pricing.
Here’s a TLDR for you:
- Databox has customizable dashboards, and they even support an engineer to do with you sometimes
- It has most amount of integrations, if they don’t — you can request or ask their engineer to make it for you
- Custom metrics features helps me create different metrics that tools usually don’t provide
- Weekly notifications keep your boss and team always updated
- The customer support is world-class.
But first, full transparency: I may receive commissions if you click on some of the links in this article, but it won’t cost you a thing! Also, the companies do not pay me to write these reviews. I test the products and services myself, and I support them regardless.
Table of Content
Databox Review: Overview
Databox is a business analytics tool that helps you track your business’s performances across multiple channels. It’s a KPI dashboard tool that combines various data sources to make real-time observations.
Databox can also be used to make graphs, charts, and reports with data collected from multiple sources. The data can be modified with a simple drag-and-drop feature, making it convenient for non-experts. Moreover, you can further customize the data to suit the user’s needs. The whole user interface is highly intuitive and suitable for users of all levels.
Databox can send weekly and monthly reports on KPIs and other key indicators of businesses. This feature allows departments such as sales, marketing, eCommerce, customer service, etc., to monitor the KPIs and ROI of their activities. Visualizing all forms of data allows you to make correlations between different campaigns and channels, which equips you with better decision-making opportunities.
Databox has 70+ integrations, including tools such as SEMrush, Shopify, Google Analytics, etc. It also has an iOS and Android app version. You can access the dashboard and seamlessly make reports through the mobile version of Databox.
Databox Review: Key Features
Let’s look at the unique features you will find in Databox.
Customized Dashboards
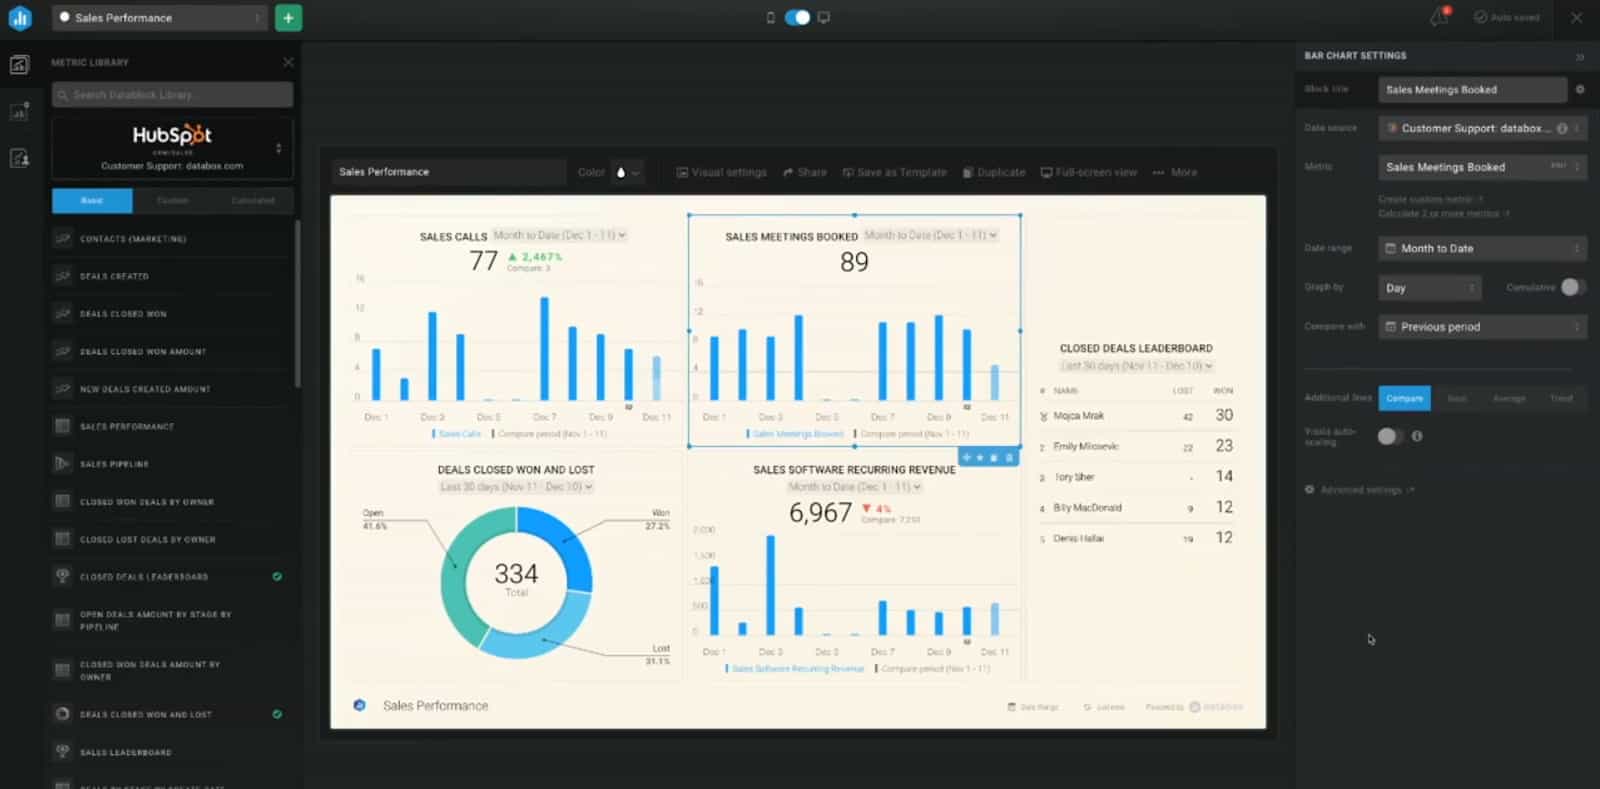
Databox’s custom dashboard is your one-stop solution for all your business analytics needs and is designed to deliver a highly intuitive and straightforward user experience.
You can create a meaningful dashboard from scratch within minutes. You can choose from 70+ data sources and pick the ones that work for you. If you’re not interested in building something from scratch, you can use one of Databox’s 200+ templates. You can tweak and add subtle customizations to those premade templates to suit your needs.
One of the best parts of the dashboard is how you can view data from multiple sources together. You can drag and drop the data that you need in a report. Besides, there are options to make multiple reports using various data sources. You may also view the data sources as graphs, charts, or other advanced analytics.
Finally, you can measure the current performance of your metrics with past historical data or according to the standards you’ve set.
Goal Tracking
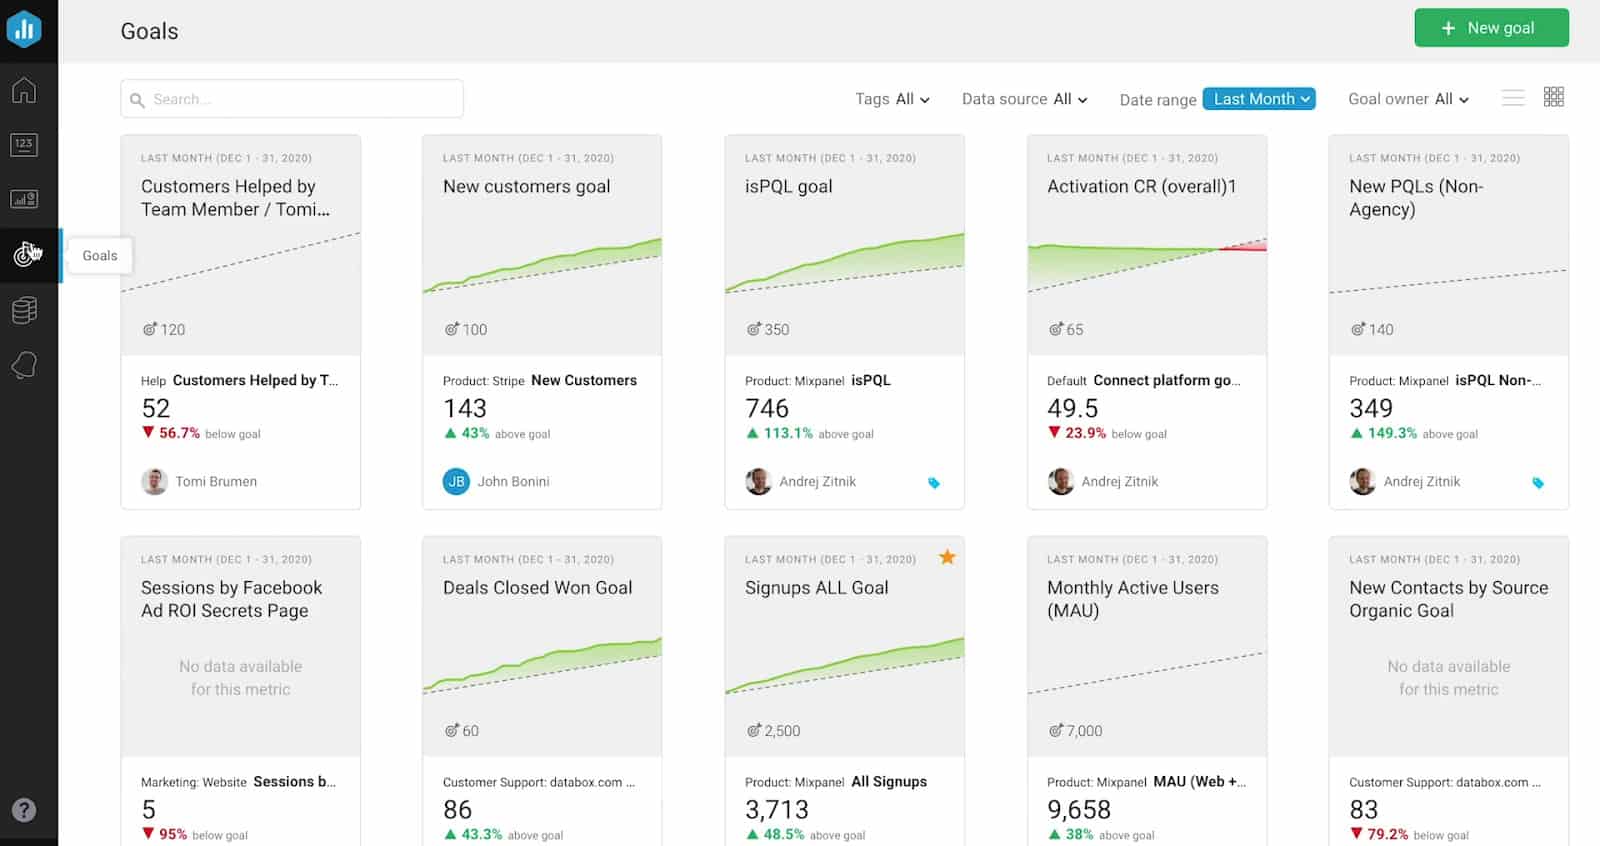
In spreadsheets and traditional data visualization software, you must create two separate visuals to compare your current performance and goals. But Databox allows you to add these two features in a single visualization.
You can set a particular goal for any metric from any data source, and the visual will start comparing the current performance. Additionally, you can use multiple goals and metrics in the same report. This allows you to view all the key performances in the same dashboard.
You can track the goals in real-time data. Moreover, you don’t have to worry about constantly sitting in front of the screen, as Databox will automatically notify you when your goal is off track.
Databox automatically calculates and converts your long-term goals into short-term (weekly, monthly) objectives. This allows you to evaluate your performance even better. Additionally, you can view the goals on multiple Databox platforms.
Performance Scorecard
The conventional way to scorecards for a company was assigning designers or experts to manually make scorecards by scrambling through data from multiple tools. But as all your data remains in a single place in Databox, you can make a scorecard using data from various sources.
Databox allows you to choose up to 15 metrics for a single scorecard. You can make as many scorecards as you need. The metrics can be taken from any data source whatsoever. All you have to do is fix a time (daily, weekly, monthly, etc.) when the scorecard will be sent, add team members who’ll view the scorecards, and set the medium through which they will receive it (email, slack, or mobile notification).
Databox will automatically make the scorecards. Also, the scorecards give a general overview of performances as well. This allows your team member to formulate a strategy with real-time data in case you can’t meet your goals.
Integrations
One of Databox’s notable features is its seamless use of 70+ integrations. You can use your familiar tools to create the perfect KPI dashboard for your company. As mentioned earlier, you also have the option to include multiple reports.
The integrations are from different categories such as analytics, website marketing, sales, CRM, eCommerce, email, project, management, and many more.
Databox’s integrations include Google Analytics, Hubspot, LinkedIn, Shopify, Google My Business, etc. Databox also uses third-party integrations such as Trello, Slack, Amazon, etc.
It doesn’t end after you choose a tool to integrate. You can customize and fine-tune the tool, like changing font and color schemes, visualization methods, graphs and charts, metrics, etc. The best part is that no coding is necessary to use these integrations.
Calculation of Metrics and KPIs
Databox has a robust way of measuring metrics and KPIs. While you can use multiple metrics to measure your company’s performance, calculating those metrics can be tedious. That’s where Databox comes in.
You can set the standards on how you’ll measure metrics. That includes sales conversion, ROI, customer lifetime value, customer acquisition cost, etc. Then you can send the ratios and calculations to your team members via weekly and monthly scorecards.
Multiple Platforms
Databox’s dashboards are available on different platforms such as desktop, mobile, TV, and apple watch.
Databox is optimized to fill the entire width of any of the mentioned devices. Viewing your company’s performance on the office TV may boost some employee performance. As all the changes are synced throughout the platforms, any change through mobile will be displayed on all other platforms.
You can view all the analytics and data visuals through the mobile version. Databox will also send important notifications regarding changes in performance to your phones. Additionally, you can make changes through the mobile version if your desktop or laptop isn’t around.
What’s interesting is that Databox is also available on Apple Watch. You can sneak a peek at your Apple Watch to see how your important marketing campaign is doing. All these will increase the awareness and accountability of your team’s employees.
Databox Review: Pricing

Databox has three different paid plans:
- Starter Plan: It has daily monitoring and reporting for small-sized businesses. You can access this plan by spending $72 per month. You will get 4 Data Source Connections (you can add extra data source connections through additional payment) and 4 Databoards with the starter plan. It can have a maximum of 5 users with 11 months of data storage. Additionally, you get 12+ standard features, 60+ Databox integrations, and 3000+ prebuilt metrics. You can also include 2000+ third-party integrations. A starter plan is perfect if your operation scale is small and can manage with just daily reports.
- Professional Plan: The professional plan provides hourly monitoring and reporting for small to mid-sized enterprises. You’ll have to pay $135 per month to use the professional plan. This plan allows you to have 3 data source connections (you can add extra data source connections through additional payment) and 9 data boards. A maximum of 25 users can use the professional plan, and you can store the data for up to2 years. In addition to the starter plan’s features, you’ll also get Google Sheets integration, SQL database integrations, query builder, data calculations, custom date ranges, and many more. The professional plan is what you need if you have mid-sized operations and where you must receive hourly updates on your business.
- Performer Plan: The final plan is the performer plan. This plan has been specifically for businesses whose scale of operations is larger. You’ll have to pay $231 per month for this plan. With this plan, you will get 3 data source connections (you can add extra data source connections through additional payment) and unlimited data boards. You can also have unlimited users on this plan. Moreover, Databox will store the data for an indefinite period, which will be updated hourly. In addition to the professional plan’s features, you’ll also get access to features like advanced reporting, fiscal calendars, and many more. The performer plan is for you if you are considering upscaling your business.

Databox Pros
- Intuitive User Interface
- 70+ Databox and 2000+ third-Doe integrations
- No coding is required
- Multiple platforms like desktop, mobile, TV, and apple watch
- Drag-and-drop feature
- Affordable pricing
- Automated notifications
Databox Cons
- Too much communication and email but with level of expertise needed, I think it is good
- Some integrations can be a bit difficult to optimize
- Requires time for initial set-up
Databox Review: Who is It For?
Databox is for small, medium, and even large-scale companies looking for a one-stop solution for all their KPI monitoring and evaluation problems. I recommend Databox to companies that want to make their decision-making approach data-driven through business analytics tools for better results.
Databox Review: 3 Things I Love About Databox
Databox is packed with spectacular features, making it harder for me to choose my favorites. However, the following three are what stand out the most.
Customizable Dashboard Even With Your Internal Codebase
Databox’s dashboard differs from most other business analytics software, and the drag-and-drop feature makes the whole thing accessible even for beginners. Moreover, adding different metrics from multiple data sources equips the dashboard with limitless possibilities.
The data visualization types include charts, graphs, pie charts, advanced tables, progress bars, pipelines, etc. The subtle customization options allow you to make reports for both senior members and customers.
Custom Metrics Calculator
Calculating different metrics can be a tedious process. More often than not, you need coding and complex calculations in spreadsheets to complete the process. Databox does all these things for you!
You can measure and display a variety of calculations using the custom metrics calculator feature. As mentioned before, Databox can simultaneously deal with multiple data from different sources. You can calculate different custom metrics using these data sources. Moreover, ROI determination and other financial calculations can be instantly done using Databox. Finally, you can track your progress in real time to get the overall progress of the goals you’ve set.
Accurate Insights
Databox’s data visuals contain real-time data that are updated daily. The data from multiple sources seamlessly sync with each other. As a result, the calculations are always accurate.
The space for customization of data visuals allows the team members to understand the data easily. The simplicity of information presentation and error-free data will provide accurate insights.
The only downside of Databox is the time required for initial set-up. Moreover, not having a basic idea about data analytics will make the whole thing even more complicated. You may not know the use of some features like “Advanced Reporting.” So it will take some getting used to your part to make the most out of Databox.
Final Verdict
So now you have a solid Databox review in front of you.
Databox is perfect for creating a KPI dashboard, especially for getting the most out of campaigns. It helps you track all the activities and campaigns in your business.
Databox will also help you save time and energy by bringing all the scattered information to a single place. Apart from that, you won’t have to invest time in the dreaded reporting and sharing tasks.
Databox is especially important for companies that regularly run different marketing activities. The information received can help you run successful campaigns. Moreover, the data will also help in customer acquisition and retention.
In short, using Databox will ultimately result in better employee performance as your team will be serious about their performance. But if you are skeptical of the pricing plans, you may decide after trying Databox for its trial period. So start your free Databox trial today!
Full Disclosure: If you click on some of the links in this article and purchase a paid plan, I may receive affiliate commissions (at no cost to you!). Regardless, the products and services I review are some of the best I’ve tried, and I support them personally. To know more, head over to my privacy policy & affiliate disclosure.
P.S. Check out my podcast (with 77 episodes and more on the way!) if you’re interested in actionable growth marketing and hearing from actual marketers about how they’re taking their businesses forward.